HFM's 2020 Market Outlook
Posted by Team HFM on January 17, 2020
At the beginning of 2019, the markets looked dismal with the S&P 500 having dropped almost 20% from its high near the end of September 2018 to its low on Christmas Eve. We were assuring you that we did not believe that we were entering a bear market and the economy was not about to enter a recession. As we head into an election year with all of the associated angst, we still feel the same way, no imminent recession or bear market.
But the investment landscape looks decidedly different now than it did last year. The S&P 500 is more than 30% higher than it was last year and interest rates are substantially lower. The Federal Reserve, having been spooked by the combined swoon in the equity markets and the indications that the economy was slowing quickly due to the imposition of tariffs, cut its benchmark rates 3 times for a total of 0.75%. The rest of the bond market followed the Fed’s lead and interest rates fell across all maturities. Economic growth slowed, as was expected by the consensus, but consumers, who make up the bulk of the economy, actually held up quite well as spending increased, wages went up, and consumer debt levels remained near post-recession lows.
So where does that leave us for this year? Let’s start with the stock market and a look at some of its history. We don’t know exactly what the total earnings for the S&P 500 stocks were in 2019 because fourth quarter earnings have not been announced. However, based on consensus estimates, it appears that earnings were essentially unchanged. How then did we get a 31.5% increase in the S&P 500 if earnings didn’t go up? About 2% of it came from dividends, but the rest (aside from a minor adjustment for the change in the number of shares outstanding) simply came because the market became more expensive. One way to look at that is to say that the ratio of the price of stocks to their earnings (the P/E ratio) increased. The following chart shows a history of that ratio since 1990.
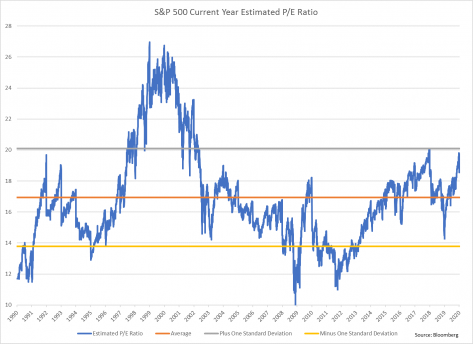
It is interesting to note that the 2020 beginning level of 18.68 is well below the peak of almost 27 that occurred during the dot com bubble, but it is close to the high end of the range that is defined by a one standard deviation spread around the average (note: this is the range closest to the average that includes 2/3 of all of the data points). The top end of that range is about 20. It would certainly be possible for the P/E ratio to go above 20, but we believe it is unlikely in normal market circumstances (i.e. outside a bubble market).
Consequently we do not believe there is much room for the S&P 500 to become significantly more expensive in 2020. If 20 is the upper bound for the P/E ratio, that limits the return on the S&P 500 to about a 7% price appreciation plus a dividend of about 2% or a total return of 9%. This is an election year though, so exuberance or depression can add a significant band of uncertainty around that estimate. Not only that but that ratio is based on earnings expectations for this year, which also can vary significantly, as it has in past years. To put some perspective on the uncertainty, the average middle of the year market pull back is 11% for just the years in which the market ended higher for the entire calendar year. If those sound like a lot of caveats, they are. 9% is certainly not a hard and fast prediction. Predicting the market over a one year period is dicey at best. But it does reflect our sense that the market is unlikely to be as exuberant as last year, but also is unlikely to fall significantly either.
Surprisingly, the bond market also had a very good year last year, rising 6.7%. That return came from a combination of interest income and the price appreciation that resulted from the fall in yields during the year. That fall in yields was in response to the 3 times the Federal Reserve cut its benchmark overnight rates. The Fed action followed from a particularly bad fourth quarter in 2018 in which stocks fell almost 20% and the economy appeared to be stalling under the weight of increased tariffs.
While we certainly appreciate the price increases in the bond market, unfortunately that leaves us with a bond market that has very low yields. The 10 year U.S. Treasury bond began the year with a yield of 1.92% and if you subtract inflation from that, it has a net yield of 0.30%. In the chart below, you can see the progression of the 10 year yield and its net yield after adjusting for inflation.
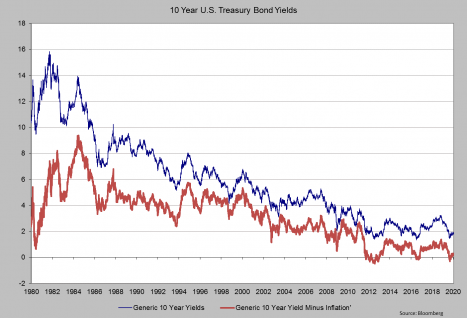
The chart indicates that low yields have remained in a tight, low range since about 2012, as the economy struggled to recover from the great recession. Last year’s drop in yields put us near the low end of the range, a low that we would be very surprised to see broken. As a consequence, we believe the best case scenario for bonds this year would be for yields to stay low and for investors to just collect the interest. If yields increase, bond prices will come down and the combination of low income and lower prices will lead to paltry returns for bonds. There is a possibility of yields trending even lower and prices increasing, but the economic scenario that would support that situation would be grim, which in turn would lead to a downturn in the stock market. We believe that situation is unlikely. We think that the current strength in the economy will continue allowing yields to rise, but at a muted rate which will put a damper on bond market returns.
In summary, while we have not painted the rosiest picture for 2020, we do believe it will be a reasonably good year with mid-single digit returns for diversified portfolios and low but steady economic growth.
Happy New Year everyone.